Get in Touch with BOSHIYA


Updated November 2026 · Reviewed by the BOSHIYA Group Technical Team
Contents
show
A steel cost estimation tool can convert part geometries, shop hours, or melt-shop mass balances to a cost estimate. Buyers can lose margin when applying a bar weight sheet to complex assemblies or unscoped mill investments. Using the right estimating method for your engineering definition helps avoid pricing errors and major utility omissions on plants, and can capture differences in metric and short tons.
Rising volatility in raw material markets, combined with stricter carbon borders, increased the risk for capital planners. Mill raw-material baskets and shop hourly rates can change rapidly enough to invalidate static lookup sheets in a single quarter. Below are gross-to-net weight calculations, benchmarks for structural labor, a closed-mass 100-tonne DRI worksheet, and plant boundary rules.
Quick Specs: Steel Cost Modeling Reference Benchmarks
| Standard Wrought Alloy Densities | 7,850 kg/m3 carbon steel · 8,000 kg/m3 stainless steel · 2,700 kg/m3 aluminium |
| Ton-to-Tonne Unit Ratio | 1 metric tonne (1,000 kg / 2,204.62 lb) = 1.10231 US short tons (907.185 kg / 2,000 lb) |
| AACE Process Estimate Classes | Class 4 screening: 1%–15% definition (−30% to +50%) · Class 3 FEED: 10%–40% (−20% to +30%) |
| Greenfield Plant CAPEX Ranges | $300M–$600M EAF mini-mill · $800M–$1.5B hybrid DRI-EAF · $2B–$5B BF-BOF (BOSHIYA) |
| Melting Energy Accounting Split | 430–460 kWh/t cold-scrap EAF · 350–400 kWh/t 600 °C+ hot DRI · 18–22 GJ/t BF-BOF primary |
What Is a Steel Cost Estimation Tool and When Do You Need a Full FEED Study?
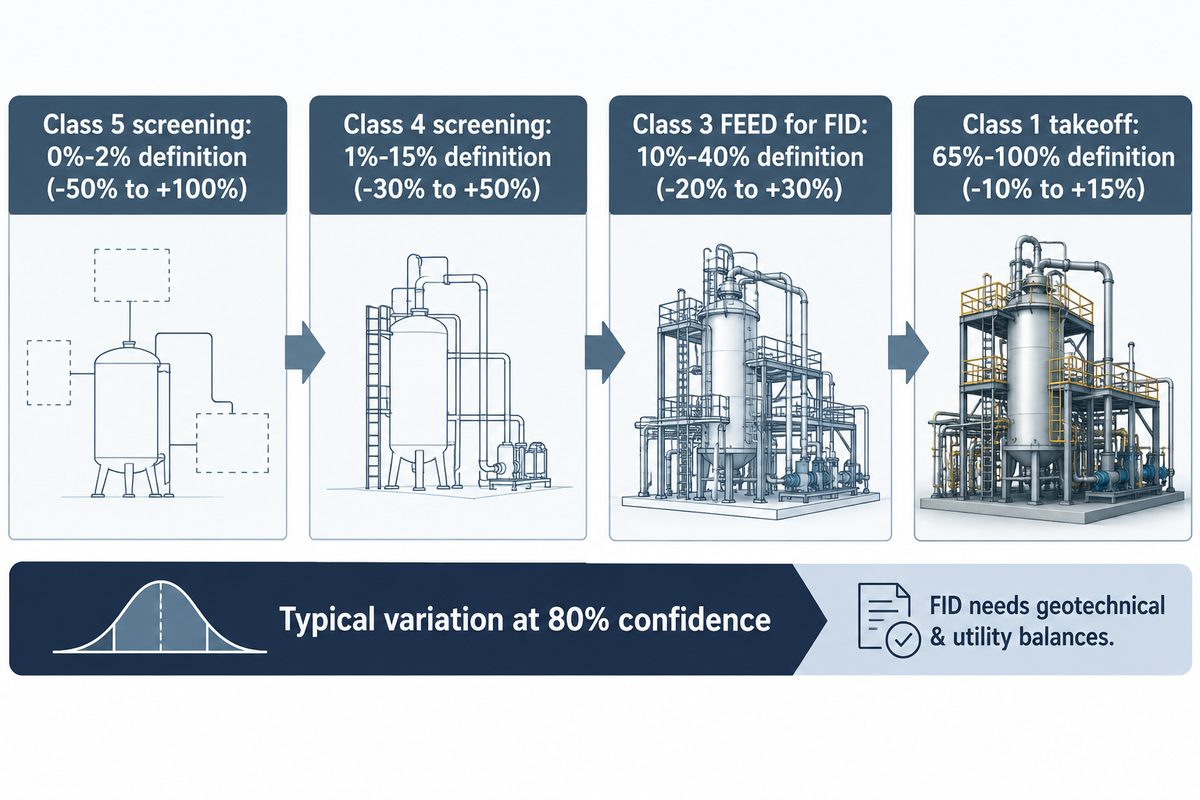
Under the Cenex summary of AACE International RP 18R-97, Class 4 screening models run at 1%–15% project definition (−30% to +50% accuracy), while Class 3 front-end engineering design (FEED) authorization requires 10%–40% definition (−20% to +30% accuracy). Software calculators handle part weights or concept screening, whereas site utility engineering governs final capital approval.
Industrial buyers use the same phrase to describe four distinct levels of software. Cost calculator, a basic bar weight software, estimates theoretical masses from dimensions. A job-shop software adds bending and weld hours, and laser cutting from 3D models. Commodity margin boards track spot scrap against hot-rolled coil. For capital investments, BOSHIYA’s steel cost estimation tool helps compare different blast furnaces, EAFs and DRI-EAFs during project planning.
Published AACE accuracy bands represent typical variation at an 80% confidence interval rather than fixed guarantees, so each estimate requires project-specific risk analysis. Early Class 5 screening (0%–2% definition, −50% to +100% accuracy) and Class 4 models can’t price local soil piling or closed-loop water treatment. They also omit high-voltage utility step-down substations (such as 138 kV incoming mill feeds). Online Class 4/5 tools support route comparison only; final investment decisions (FID) still require a Class 3 FEED study with geotechnical borings and utility mass balances. Upgrade to Class 1 unit-cost takeoffs (65%–100% definition, −10% to +15% accuracy) before signing fixed-price subcontracts.
Use the 4-Tier Steel Cost Model Selector to pair nine buying tasks to the right engineering and modeling methods.
| Procurement Scenario | Model Tier | Core Inputs Required | Trigger to Upgrade Method |
|---|---|---|---|
| Single plate, tube, or round bar order | Tier 1: Geometric Mass Formula | Dimensions, alloy density, mill $/kg | Part requires contour nesting or bevel cutting |
| Wide-flange structural beam stock list | Tier 1+: Linear Stock-Length Plan | Cut lengths, 40 ft vs 50 ft mill lengths | Offcut drop losses rise on standard mill lengths |
| Laser-cut and bent sheet enclosures | Tier 2: Sheet Metal Job Costing | True-shape nesting, pierce count, press setups | Irregular profiles nested by bounding box |
| Machined flanges, shafts, and manifolds | Tier 2: Multi-Axis Machining Model | Billet mass, chip removal rate, fixture hours | 316 stainless work-hardening slows feed rates |
| Structural steel building or pipe rack | Tier 2+: Component-Level Shop Takeoff | Member hours/t (8–40+ hr/t), surface area m2 | Assembly mixes heavy columns with stairs/trusses |
| Quarterly coil or rebar supply contract | Tier 3: Commodity Margin Databoard | Iron ore, coking coal, scrap, alloy surcharges | Regional tariff quotas shift import parity |
| Melt-shop scrap vs DRI charge buying | Tier 3+: Stoichiometric Charge Model | Metallization fraction, silica assay, CaO/SiO2 target | Pellet gangue shifts lime flux and slag volume |
| Early steel plant route screening | Tier 4: AACE Class 4/5 Parametric Tool | Target Mt/yr, route (EAF/DRI/BF), power $/kWh | Site needs 80+ MVA grid substation or hot-strip mill |
| Final steel mill FID & lender approval | Tier 4+: AACE Class 3 FEED Study | P&IDs, vendor quotes, soil & water loop design | Transition to Class 1 MTO before fixed-price EPC |
Steel Weight Calculator and Material Cost Formulas: Per Kg, Per Pound, and Scrap Yield
Plain carbon steel weighs 7,850 kg/m3, or 40.8 lb/ft2 per inch of thickness in RenderDraw’s structural steel waste-factor guide, while 1 metric tonne (1,000 kg) equals 1.10231 US short tons (907.185 kg). Divide net part mass by nesting yield before multiplying by unit price so bid sheets deliver precise estimates.
How to calculate steel per kg?
Multiply part volume (in cubic meters) by 7,850 kg/m3 for mild carbon steel to get net mass. Divide net mass by (1 − scrap fraction) for gross buyable weight per piece, then multiply by your mill rate per kg.
Core Engineering Mass & Gross Material Cost Equations
• Flat carbon steel plate net mass (kg) = Length (m) × Width (m) × Thickness (mm) × 7.85
• Solid carbon steel round bar mass per meter (kg/m) = Diameter (mm)2 ÷ 162.2
• Gross material cost ($) = [Net Mass (kg) ÷ Nesting Yield] × Price ($/kg) − [Scrap Mass (kg) × Scrap Credit ($/kg)]
• Flat carbon steel plate net mass (kg) = Length (m) × Width (m) × Thickness (mm) × 7.85
• Solid carbon steel round bar mass per meter (kg/m) = Diameter (mm)2 ÷ 162.2
• Gross material cost ($) = [Net Mass (kg) ÷ Nesting Yield] × Price ($/kg) − [Scrap Mass (kg) × Scrap Credit ($/kg)]
A theoretical steel weight calculator only outputs finished geometry mass. Real plates and bars ship in fixed mill stock dimensions. RenderDraw’s worked examples show that nesting 62 ft2 of base plates onto a 96 ft2 plate achieves a 65% yield (a 55% waste markup). Ten W12×26 beams cut to 23 ft 4 in generate 71% drop waste from 40 ft stock before offcut reuse. Ordering 50 ft stock cuts that waste to 7% and saves 3,900 lb of steel. Shop owners on fabrication forums note that bounding-box approximations distort irregular gusset yield unless true contour nesting runs first.
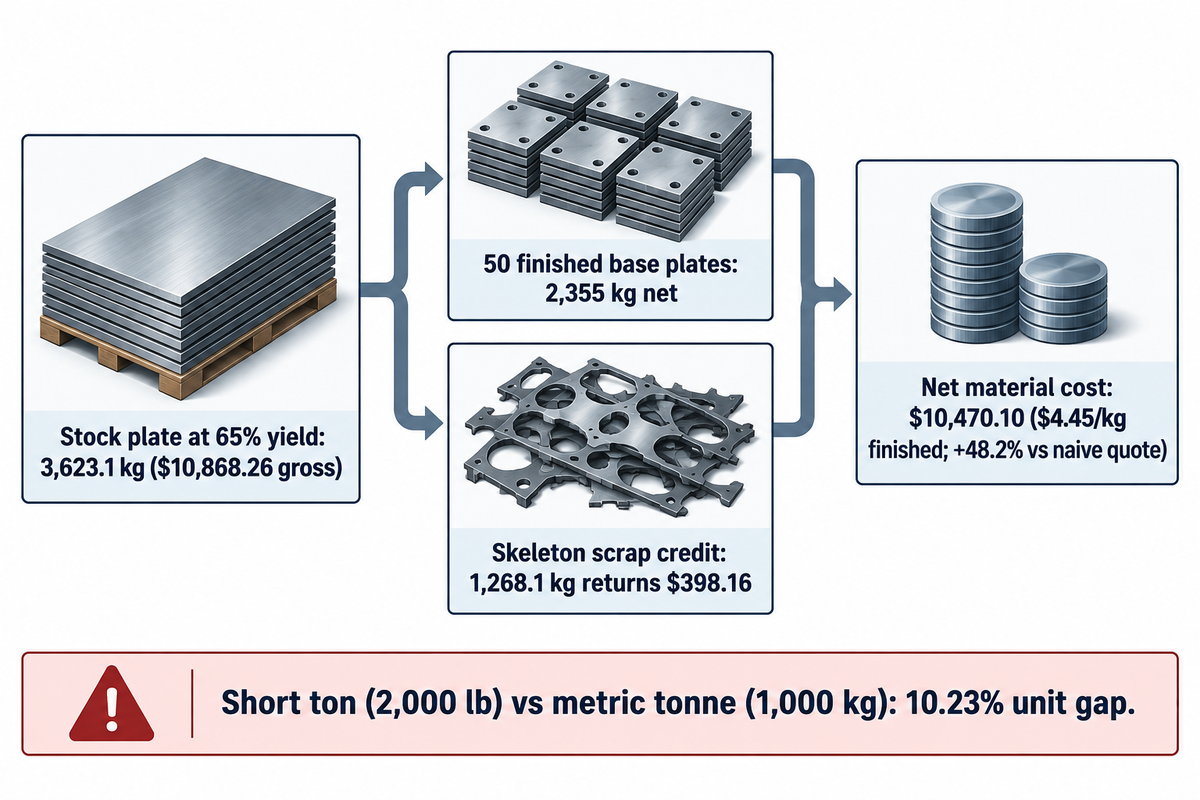
Worked example (plate gross-to-net cost): Suppose you quote 50 carbon steel base plates measuring 0.60 m × 0.50 m × 20 mm. Benchmarking stock against Gordian’s Q4 2026 North American structural steel index of $2,721.31 per US short ton ($2,999.73 per metric tonne, or $3.00/kg), assume 65% nesting yield and MCI’s $313.99/t ($0.314/kg) steel scrap credit. Each finished plate weighs 0.60 × 0.50 × 20 × 7.85 = 47.10 kg, totaling 2,355 kg net. At 65% yield, you buy 2,355 ÷ 0.65 = 3,623.1 kg of stock plate ($10,868.26 gross). Recovering 1,268.1 kg of skeleton scrap returns $398.16. Net material cost is $10,470.10 ($4.45/kg finished), sitting 48.2% above a naive $7,064.36 net-weight quote.
Cross-border bids also trip over ton definitions. Treating a 2,000 lb US short ton as a 1,000 kg metric tonne understates raw steel cost per kilogram by 10.23% before cutting begins.
Metal Fabrication Costs, Sheet Metal Job Costing, CNC Machining, and AISC Welding Scope
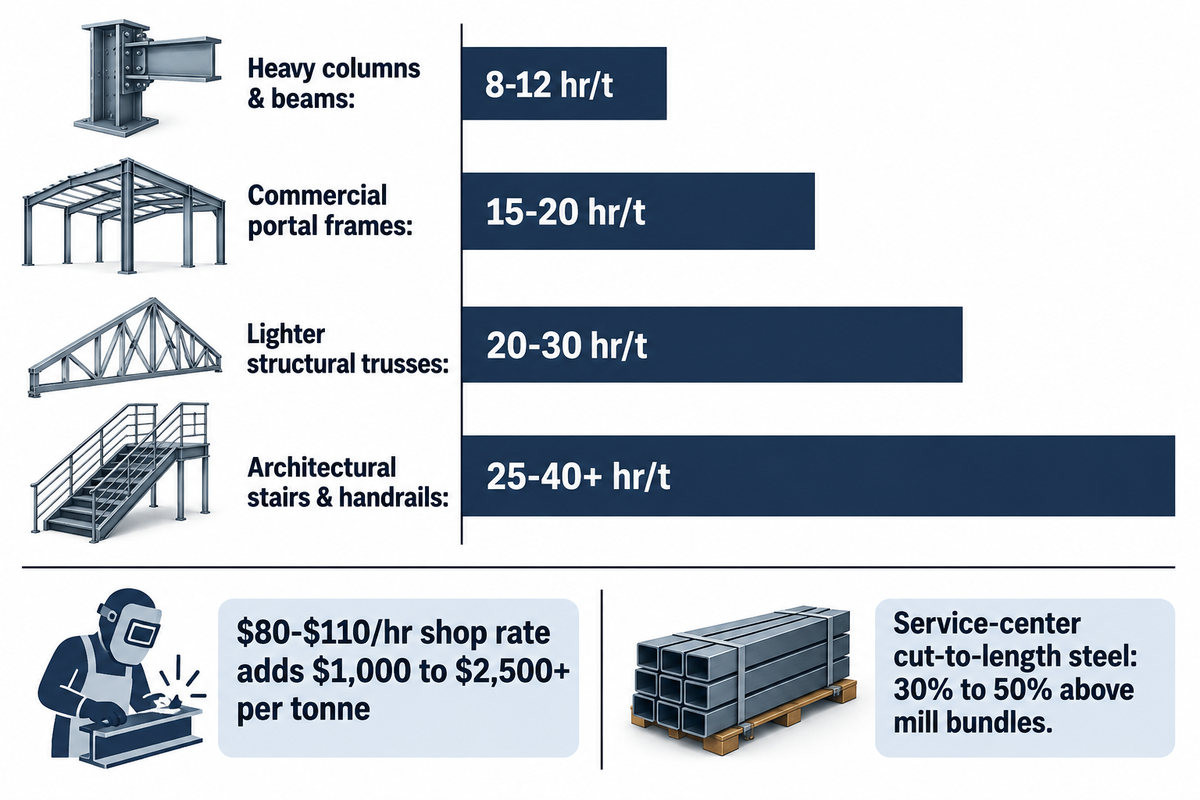
Downstream fabrication costs stack setup labor, machine cycle time, filler metal, surface prep, and shop overhead onto gross steel spend. In SteelQuote’s structural fabrication estimating reference, fully absorbed shop rates of $80–$110 per hour add $1,000 to $2,500+ per metric tonne because member hours vary fourfold.
How to price structural steel fabrication?
Split the 3D CAD model into member families and add 5%–10% cutting waste plus 5%–10% cleat weight per SteelQuote. Assign hours per tonne by member complexity, price blast-and-paint from surface area (m2), and multiply by your shop rate.
Quoting from one blended dollar-per-tonne rate is a classic bidding trap. SteelQuote lists 8–12 hr/t for heavy column-and-beam packages and 15–20 hr/t for commercial portal frames. Lighter trusses require 20–30 hr/t, while architectural stairs or handrails consume 25–40+ hr/t. Two packages of identical tonnage can differ by thousands of dollars per tonne on shop hours alone. Experienced estimators dissect assemblies piece by piece instead of applying flat tonnage multipliers.
Precision parts follow a different fabrication process build-up. Across sheet metal fabrication shops, laser cutting commonly generates 5%–10% skeleton scrap, blanking produces 10%–20%, and deep drawing reaches 15%–30%. Press-brake setups and hardware insertion then drive the cost per part on short batches. When a metal fabrication project requires CNC machining on AISC splice plates or bearing housings, job costing separates CAM programming from spindle minutes per hole.
⚠️ Common Estimating Mistake: Weight-Based Paint & Service-Center Spreads
Do not rely on protective coatings prices based on tonnage. Thin walled hollow sections and lighter trusses have far more surface area per ton than a wide flange column, resulting in paint budgets being exceeded. An AISC teaching module, cited by RenderDraw, mentions that cut-to-length service-center steel can cost 30% to 50% more than mill-direct bundles.
An accurate cost sheet shows every shop process cost bucket separately. Include gross steel with cleats, CNC cutting and drilling hours, fit-up and weld deposition hours, coating m2, and crane handling for your specific design.
Material Selection, 316 Stainless Steel, Aluminium, and 2026 Supplier Invoice Surcharges
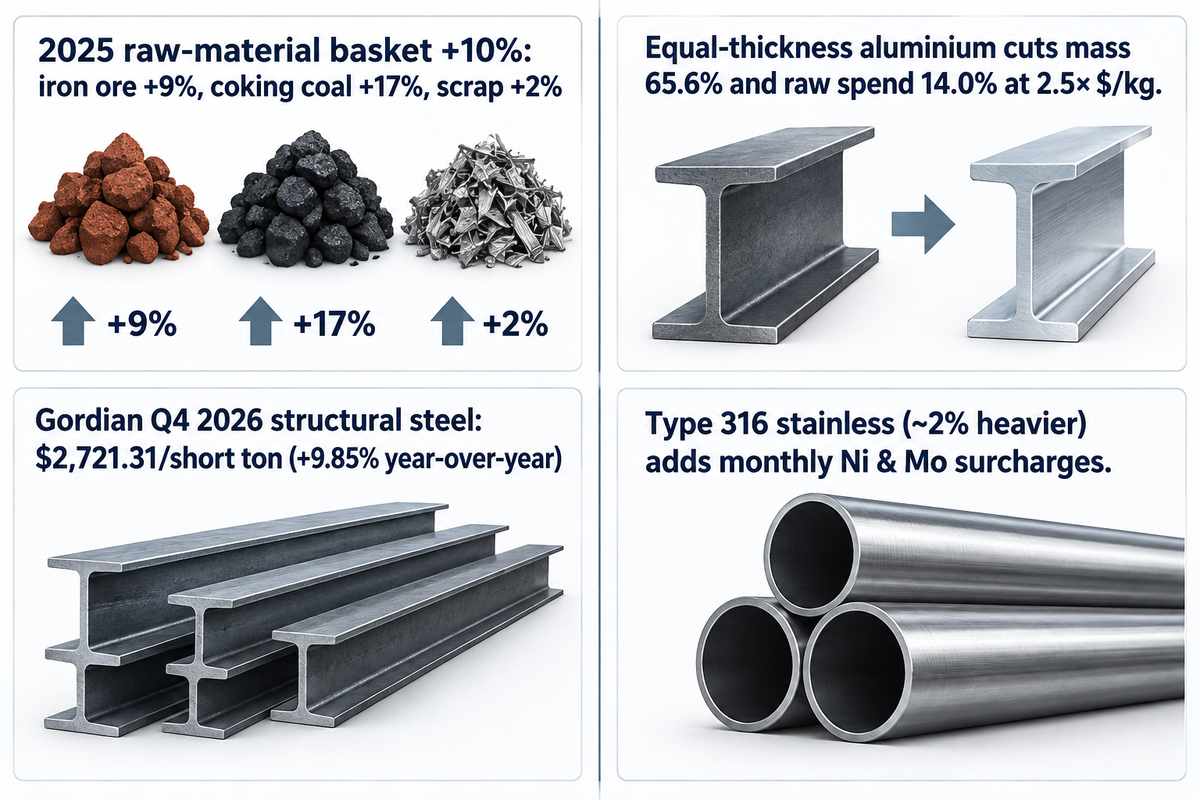
According to the OECD Steel Outlook 2026, global steelmaking raw-material basket prices rose 10% in 2025 (iron ore +9%, coking coal +17%, scrap +2%). Wrought alloy densities span 2,700 kg/m3 for aluminium to 8,000 kg/m3 for stainless steel, so buyers must audit volume mass and supplier invoices together.
What is the current cost of steel by weight?
In Gordian’s RSMeans Q4 2026 Steel Price Update, the North American Structural Steel Cost Index reached $2,721.31 per short ton (+2.28% quarter-over-quarter and +9.85% year-over-year). By January 2026, US mill prices exceeded double Chinese levels and EU coil stood 50% above China per the OECD.
Static lookup tables quickly become outdated when regional trade barriers increase. OECD analysts report that raw-material inflation squeezed margins in the steel industry in 2025 while North American structural steel increased from $2,343.93 per short ton in January 2026 to its Q4 level. Refresh regional market rates monthly so bids reflect current market spreads rather than expired coil contracts.
During material selection, comparing unit prices per kg alone misleads engineers. Replacing mild steel (7,850 kg/m3) with Type 316 stainless steel (8,000 kg/m3) adds ~2% mass plus monthly nickel and molybdenum surcharges on each invoice. Switching an unpressurized guard panel to aluminium (2,700 kg/m3) cuts part mass by 65.6% at equal thickness. Even if aluminium costs 2.5× more per kg than carbon steel, raw panel spend drops 14.0% before stiffening ribs. Specifying the right steel grade or material grade and buying in bulk mill heat lots lowers section extras when storage turnover stays brisk.
Greenfield and Brownfield Steel Plant Cost Estimation: EAF Mini-Mill, DRI-EAF, and BF-BOF CAPEX
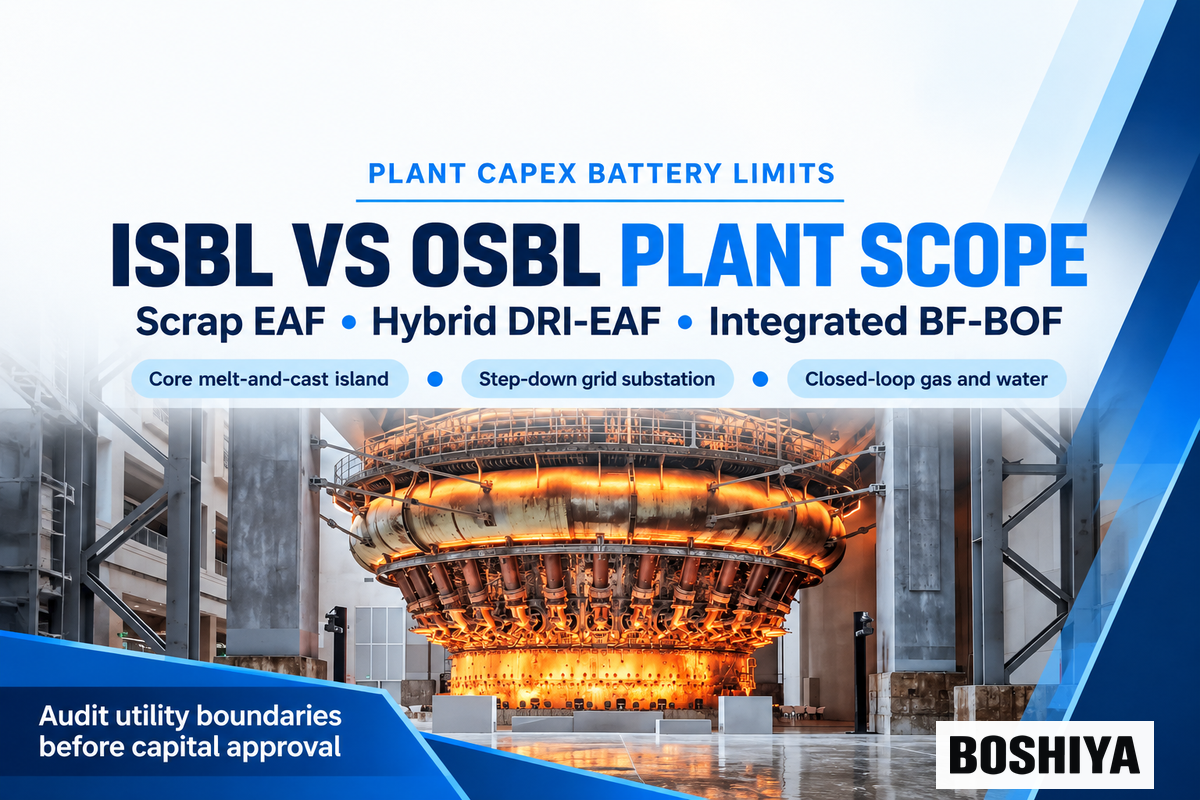
BOSHIYA’s published steel and metal plant engineering solutions benchmarks place greenfield EAF mini-mills (0.3–1.5 Mt/yr) at $300M–$600M over 14–20 months and hybrid DRI-EAF plants (1–3 Mt/yr) at $800M–$1.5B over 18–28 months. Integrated BF-BOF complexes (2–8 Mt/yr) require $2B–$5B over 36–60 months.
Boardroom cost estimate reviews stall when sponsors compare melt-shop-only quotes against integrated complexes. The Columbia Business School Climate Knowledge Initiative steel overview reports that BF-BOF produces 73% of global crude steel ($390/tonne historical average cost). Scrap-EAF accounts for 22% ($415/tonne) and natural-gas DRI-EAF holds 5% ($455/tonne), with raw materials and fuel driving 60%–80% of total cost. See our blast furnace versus electric arc furnace route comparison for reactor layout trade-offs.
Physical restrictions are very stringent for brownfield restart and relines. As per the U.S. Energy Information Administration (EIA) Industrial Steel Outlook, blast furnaces exceed lifespans of 40 years only if their refractory linings are replaced after 25 years. That reline approximately costs half of the new blast furnace. According to BOSHIYA, if the structural steel, foundations and raw-material handling systems remain in good condition, mothballed plant retrofits are 30%-40% less compared to greenfield. BOSHIYA’s CAPEX, 4-8 month component lead times and 30%-40% retrofit figures, reflect first-party core melt-and-cast scope. Wide-strip mills and external substations require separate pricing.
Run the ISBL-to-OSBL Battery-Limit Audit below to build estimates based on complete boundaries. Sponsors can then allocate contingency based on specific utility risks and make informed decisions before locking the capital budget.
| Scope Package | Scrap EAF Mini-Mill (0.3–1.5 Mt/yr) | Hybrid DRI-EAF Plant (1–3 Mt/yr) | Integrated BF-BOF Mill (2–8 Mt/yr) |
|---|---|---|---|
| ISBL Core Process Island | EAF shell, ladle furnace, billet/bar caster ($300M–$600M BOSHIYA benchmark) | Reduction shaft, reformer/heater, hot-link chute, EAF, slab/bloom caster ($800M–$1.5B) | Coke ovens, sinter strand, blast furnace, BOF converters, casters ($2B–$5B) |
| OSBL High-Voltage Power | 80+ MVA step-down utility substation & arc flicker compensation | High-MVA arc transformer + shaft compressor & carbon-capture motor drives | Captive BF top-gas/coke-gas power island + grid backup interconnect |
| OSBL Gas, Water & Air | Oxygen/nitrogen plant, baghouse fume extraction, closed-loop water (2–5 m3/t) | High-pressure natural gas or H2 pipeline, top-gas scrubber & amine CO2 unit | Deep-water ore/coal port, raw-material blending beds, blast air stoves |
| Schedule & Major Renewal | 14–20 months greenfield; modular shell/panel swaps during annual outages | 18–28 months greenfield; reformer catalyst tube & gas-cooler turnarounds | 36–60 months greenfield; ~25-year BF hearth reline (~50% of new BF cost per EIA) |
Production Costs Per Tonne: Metallic Charge, DRI Gangue, and Worked Melt-Shop Breakdown
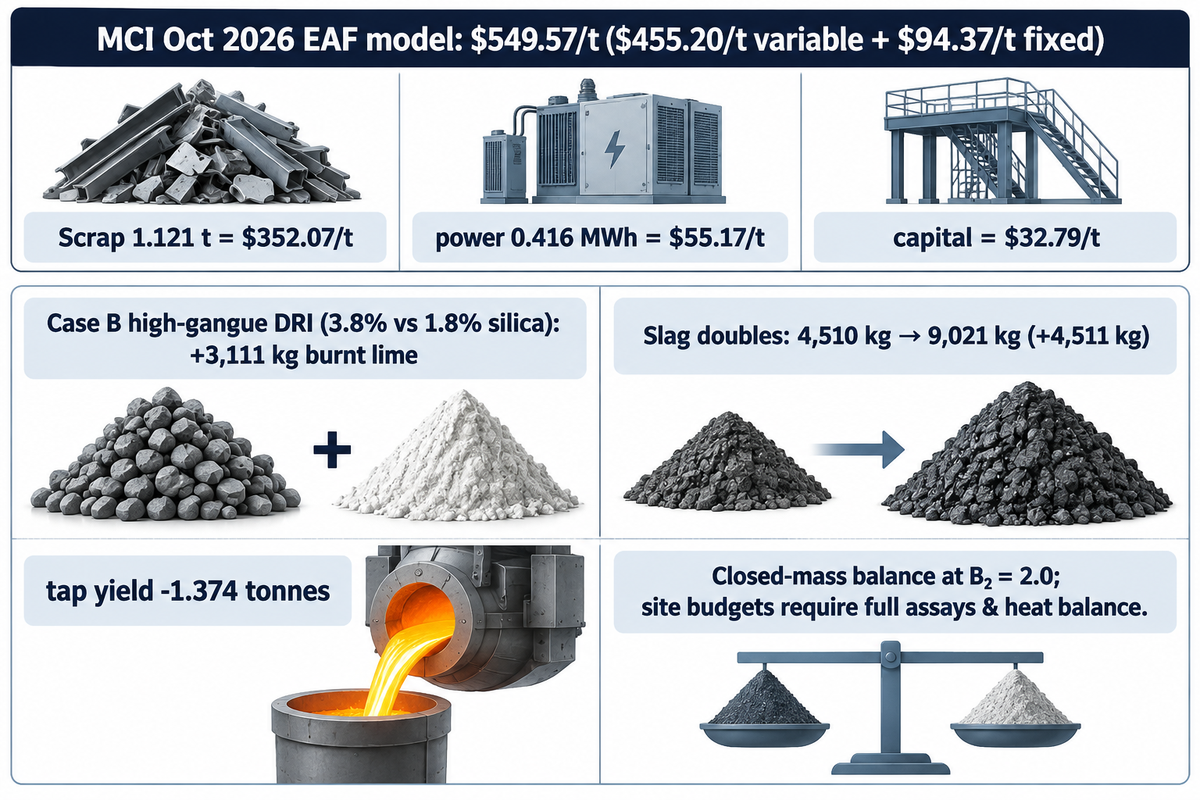
In Metals Consulting International’s October 2026 EAF cost model (1 Mt/yr 100%-scrap plant), liquid steel production costs total $549.57 per tonne ($455.20/t variable plus $94.37/t fixed). Direct-reduction shaft pellets separately require ≥67% total iron (versus ≤65% Fe in BF pellets) because retained silica drives melt-shop lime demand.
Melt-shop profitability depends on metallic yield and slag chemistry. Within that MCI variable subtotal ($455.20/t), 1.121 t of scrap costs $352.07/t, ferroalloys add $29.58/t, and 0.060 t of fluxes add $16.35/t. Refractories add $15.72/t, electrodes add $4.23/t, and scrap transport, gases, thermal fuel, carbon permits, variable labor, and other items add $37.25/t. MCI’s fixed subtotal ($94.37/t) groups $55.17/t for 0.416 MWh of power, $32.79/t in 20-year straight-line capital charges, and $6.40/t in fixed labor and overhead. For low-residual flat steel, the U.S. EIA models a 60:40 scrap-to-DRI blend to dilute copper. Meanwhile, Energies’ hydrogen-DRI techno-economic study places H-DR steel at 361–640 EUR/t, reaching BF-BOF parity near 40 EUR/MWh power and 34–68 EUR/tCO2.
Why do raw material buyers get burned with discount pellets? Midrex technical articles state that lump-ore fines lead to 1%-2% yield loss in top-gas scrubbers. Every extra kilogram of silica entering the EAF demands 2 kg of CaO to maintain foamy-slag basicity (B2 = CaO/SiO2 = 2.0) as an arc-shielding blanket. See our direct reduced iron feedstock specifications and the direct reduced iron production process for shaft chemistry.
Assumed inputs for the 100-Tonne Charge-to-Tap Mass & Flux Worksheet: Compare two hypothetical 100,000 kg charges (70,000 kg cold DRI + 30,000 kg shredded scrap with 29,550 kg Fe and 450 kg inert oxide). Target basicity is CaO/SiO2 = 2.0 using 90% CaO burnt lime. Dry DRI total iron follows Ftotal = (1 − Cfrac − SiO2,frac) ÷ [1 + (1 − metallization) × 15.999 ÷ 55.845]. Because this closed-mass balance omits dust loss, tap carbon, and furnace heat-transfer calibration, site lime and kWh/t budgets require full pellet assays and a furnace heat balance.
| Charge / Melt-Shop Parameter | Unit | Case A: DR-Grade DRI | Case B: High-Gangue DRI | Delta (Case B vs Case A) |
|---|---|---|---|---|
| Charged cold DRI + shredded scrap | kg / heat | 70,000 + 30,000 | 70,000 + 30,000 | Identical 100,000 kg charge |
| Assumed DRI metallization degree | % | 94.0% | 91.0% | −3.0 percentage points |
| Assumed DRI carbon fraction | wt% | 2.0% (1,400 kg C) | 1.2% (840 kg C) | −560 kg internal carbon |
| Assumed DRI silica gangue (SiO2) | wt% (kg) | 1.8% (1,260 kg) | 3.8% (2,660 kg) | +1,400 kg SiO2 |
| Total iron entering from DRI | kg / heat | 66,202 kg | 64,828 kg | −1,374 kg iron units |
| Residual FeO in DRI | kg / heat | 5,110 kg | 7,506 kg | +2,396 kg FeO to reduce |
| Required pure CaO at B2 = 2.0 | kg / heat | 2,520 kg | 5,320 kg | +2,800 kg pure CaO |
| Burnt lime addition (90% CaO) | kg / heat | 2,800 kg | 5,911 kg | +3,111 kg burnt lime |
| Total EAF slag mass | kg / heat | 4,510 kg | 9,021 kg | +4,511 kg extra slag |
| Theoretical external carbon for FeO | kg / heat | 0 kg | 415 kg | +415 kg carbon needed |
| Theoretical pure-iron tap mass | tonnes | 95.752 t | 94.378 t | −1.374 t tap yield |
Building detailed cost breakdowns from verified cost data exposes why Case B erodes raw material costs discounts. Extra gangue forces the addition of 3,111 kg of burned lime, 4,511 kg of slag disposal, and a loss of 1.374 tonnes of liquid iron per heat.
Energy Boundaries, Hot DRI Charging, and 2026 Carbon Cost Drivers
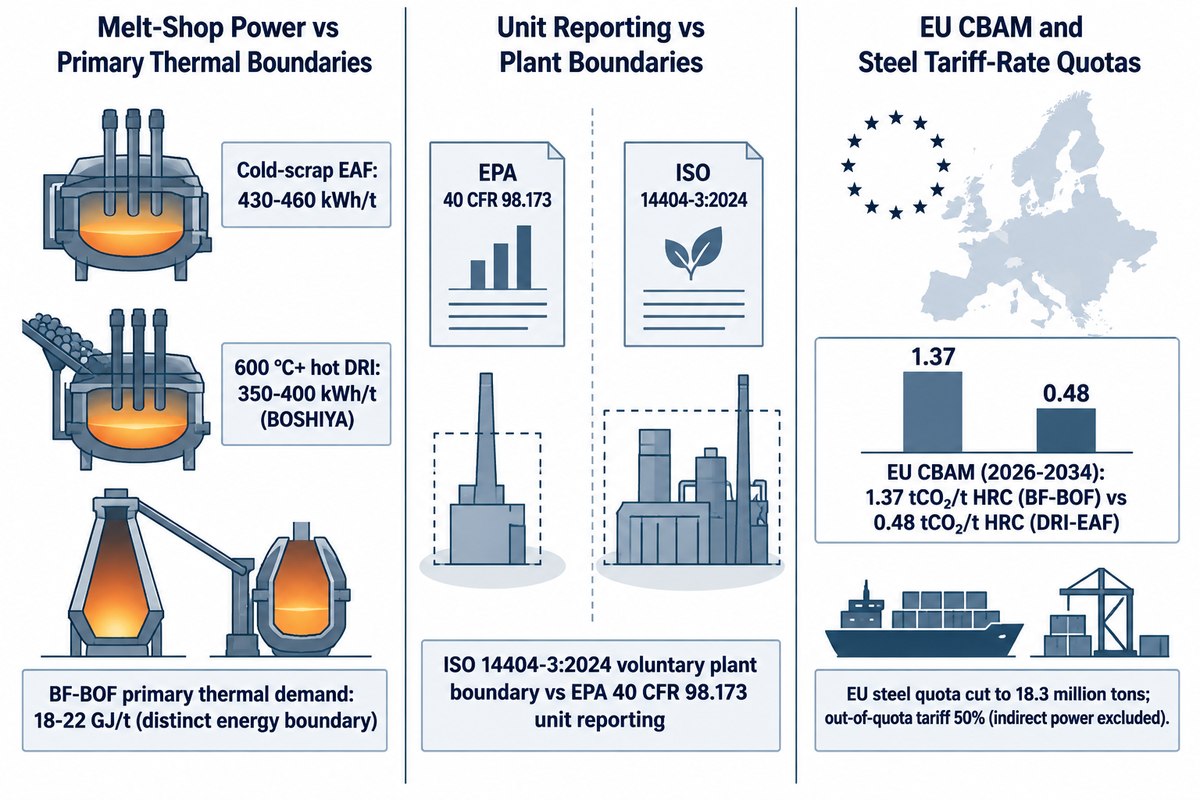
BOSHIYA plant benchmarks separate cold-scrap EAF power (430–460 kWh/t) and 600 °C+ hot-DRI charging (350–400 kWh/t, saving 15%–25% melt power) from BF-BOF primary thermal demand (18–22 GJ/t). ISO 14404-3:2024 standardizes voluntary plant-wide carbon boundaries, whereas U.S. EPA Subpart Q mandates process reporting at the facility level.
Federal GHG rules oblige facilities to “calculate and report the annual process CO2 emissions” for each furnace unit separately. Covered units span indurating, BOF, coke, sinter, EAF, decarburization, and direct reduction furnaces, including 0.008 mtCO2e per metric ton of coal in coke pushing.
Comparing 450 kWh/t (~1.62 GJ/t electrical at the transformer) directly against 20 GJ/t of blast-furnace coal mixes incompatible boundaries. For plant-wide cost estimation, ISO withdrew its 2017 edition on September 16, 2024 in favor of ISO 14404-3:2024 to capture upstream reduction gas and power. Preserving sensible heat between the shaft and EAF also reduces power spend. European Patent Application EP4127573A4 (Midrex Technologies, published June 5, 2024) discloses electric or induction DRI heating before charging as an engineering design concept rather than a guaranteed commercial kWh/t savings rate. See our electric arc furnace steelmaking operations guide for transformer tuning.
Cross-border carbon rules reshaped export estimation in 2026. RMI’s August 2026 steel carbon and trade policy analysis documented EU CBAM definitive phase (2026–2034) benchmarks of 1.37 tCO2/t hot-rolled coil (HRC) for BF-BOF versus 0.48 tCO2/t HRC for DRI-EAF. The EU’s revised tariff-rate quota for steel cut the duty-free steel imports to 18.3 million tons and doubled the out-of-quota tariff to 50%. RMI pointed out that for the EU CBAM, indirect power emissions for steel aren’t covered, and financial models need to assess the possible broadening of scope in the future.
Online Cost Estimators, Market Margin Databoards, and Turnkey Plant Providers
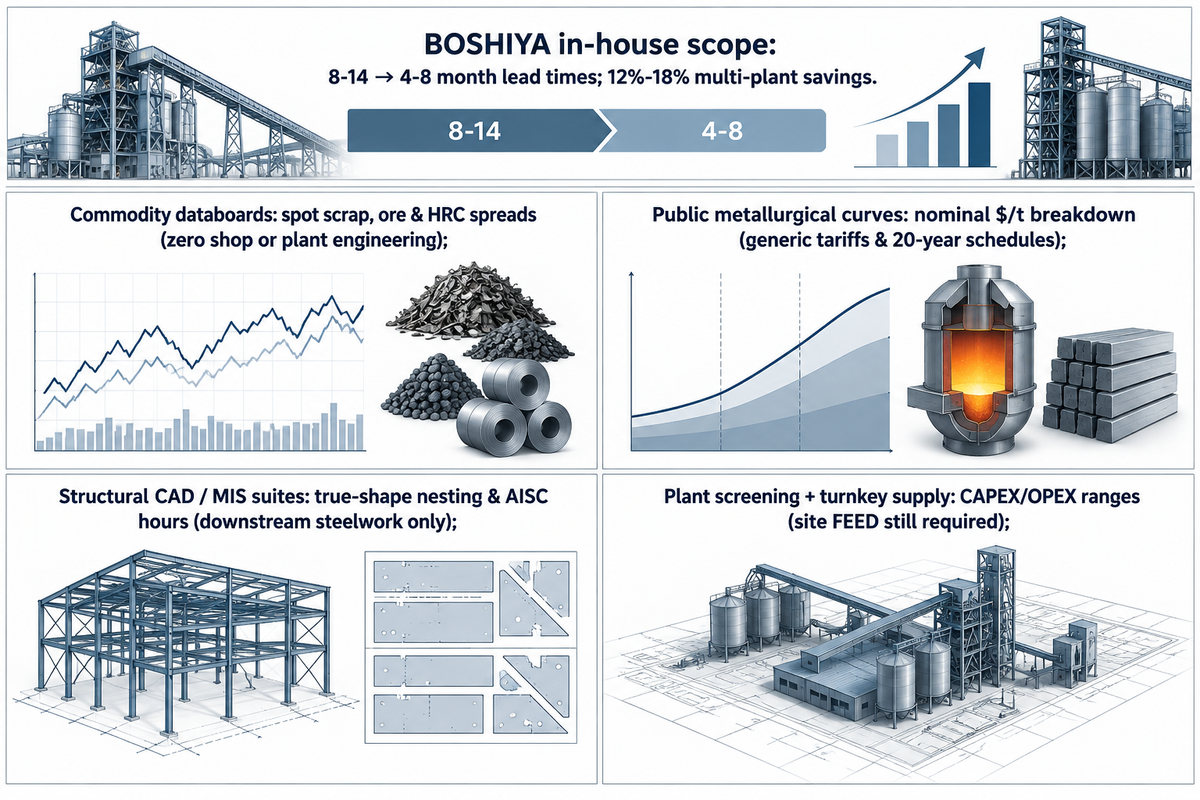
BOSHIYA’s published manufacturing scope reduces critical-path equipment lead times from 8 to 14 months to 4 to 8 months via in-house fabrication and lowers multi-plant unit costs by 12% to 18% via standardized fleet packages. Industrial buyers fuse live price data, CAD takeoff, and 3D plant models across project life-cycle stages.
There’s no single commercial estimator who prices both laser-cut brackets and an industrial melt shop. A sheet-metal web calculator offers instant DXF quotes for enclosures, and a structural MIS calculator provides CNC beam-line hours and bolt lists. At the capital tier, a plant cost estimator models route CAPEX and energy balances; BOSHIYA’s online calculator supports BF-BOF, EAF, and DRI-EAF scenarios to generate instant screening ranges. Public benchmarks like SteelOnTheNet’s EAF table (20-year straight-line depreciation and 25% fixed labor) and Columbia’s route averages employ nominal assumptions. Buyers use local delivered scrap and peak/off-peak power tariffs and carbon prices to check a supplier‘s quote against market prices.
| Platform Category | Representative Examples | What It Quantifies Well | Blind Spot Requiring Companion Tool |
|---|---|---|---|
| Commodity Spread Databoards | SteelOrbis, CRU, Fastmarkets, Platts | Spot scrap, iron ore, HRC spreads & surcharges | Zero shop labor or plant equipment engineering |
| Public Metallurgical Cost Curves | SteelOnTheNet (MCI), Columbia CKI | Nominal $/t liquid steel factor breakdown | Uses generic power tariffs & straight-line asset schedules |
| Structural CAD / MIS Suites | Tekla PowerFab, STRUMIS | True-shape nesting, stock-length optimization, AISC hours | Downstream steelwork only; no melt-shop modeling |
| Plant Screening + Turnkey Supply | BOSHIYA Plant Cost Estimator & EPC | Route CAPEX/OPEX screening + fast in-house equipment | Requires site FEED for soil, grid & permits |
Auxiliary Cooling, Heat Exchanger Turnarounds, and 5-Year TCO Procurement Checklist
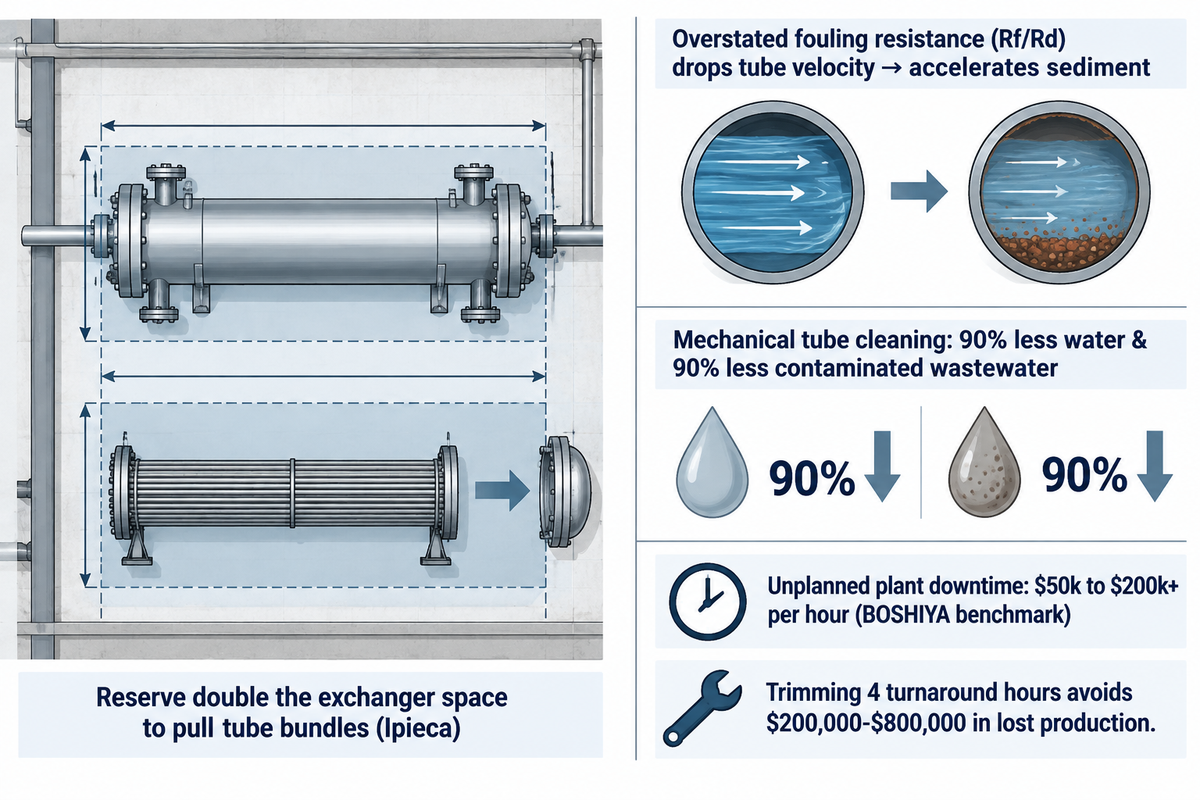
Unplanned steel plant downtime costs $50k to $200k+ per hour, according to BOSHIYA maintenance benchmarks. The Ipieca Heat Exchangers Energy Efficiency Compendium states that to remove tube bundles from an exchanger double the exchanger space is required. Omitting cooling loops and extraction gear from capital budgets increases lifecycle actual costs.
Process-gas coolers on DRI loops, transformer oil coolers, and caster water circuits don’t follow the one-line Lang factor rule. Ipieca notes that generic cost rules of thumb fail across exchanger designs and requires budgeting skids, piping, valves, controls, commissioning, and bundle-pulling clearance together. Ipieca further states that mechanical tube cleaning uses 90% less water and reduces contaminated wastewater by 90% when compared to hydroblasting. For baked deposits, turnaround planners compare the effectiveness of automated lancing versus thermal decomposition in Inspectioneering’s Part III bundle cleaning guide, and Inspectioneering’s thermal decomposition review.
Padding thermal fouling factors at specification backfires. Matt Hale shows in Chemical Engineering’s heat-exchanger fouling analysis that overstated fouling resistance (Rf/Rd) adds excess surface area and drops tube velocity. Lower velocity then accelerates sediment buildup, under-deposit corrosion, and outage frequency. During capital procurement, evaluate extraction equipment in our bundle extractor rental versus purchase cost analysis and lock pull-bay layouts early through turnkey industrial EPC project delivery.
Total cost of ownership comparison: Auxiliary Cooling & Turnaround Maintenance Scope
| Cost item | Option A: Bare Exchanger + Ad-Hoc Crane Pulls | Option B: Engineered Bay (Double Pull Space + Extractor & Mechanical Cleaning) |
|---|---|---|
| Purchase price | Base shell-and-tube unit only; zero extraction gear | Velocity-matched exchanger + dedicated bundle puller package |
| Installation & commissioning | Cramped pipe-rack access; ad-hoc rigging pads | Double bundle-pulling plot space (Ipieca) with skid, valves & controls |
| Energy (5-yr) | Higher pumping & fan load as overstated Rf accelerates fouling | Sustained heat recovery at design tube velocity without excess pressure drop |
| Maintenance & spares (5-yr) | Heavy mobile-crane rigging fees + full hydroblast wastewater treatment | 90% less cleaning water & 90% less contaminated wastewater via mechanical cleaning |
| Downtime risk (5-yr) | Extended outage exposure during unscheduled crane mobilization | Predictable shift-length bundle extraction within planned outage windows |
Turnaround exposure check: Under BOSHIYA’s $50,000–$200,000 per hour unplanned downtime benchmark, trimming 4 turnaround hours per cleaning outage avoids $200,000–$800,000 in lost melt-shop production, which buyers weigh directly against vendor quotes for hydraulic bundle extractors and pull-bay steelwork.
Copy the six verification items below into your bid package before issuing supplier inquiries. Every bidder will then quote against identical mass, metallurgy, and utility limits.
RFQ checklist — copy these into your quote request:
| Parameter | Recommended range | Why it matters | How to verify |
|---|---|---|---|
| Mass & Price Unit Basis | Metric tonne (1,000 kg) vs short ton (907.185 kg) | Prevents a 10.23% unit-price mismatch on imported vs US coil | Require $/kg and gross-vs-net nesting yield % on quote sheet |
| Structural Fabrication Breakdown | 5–10% waste + 5–10% cleats; member-class hr/t | Eliminates blended $/t padding and weight-based paint errors | Request member-class hour table and blast/paint m2 takeoff |
| DRI Feedstock Chemistry | DR-grade ≥67% total Fe (Midrex); low silica gangue | Controls 90%-CaO burnt lime demand and EAF slag mass at B2 = 2.0 | Mandate lot-level oxide assay certificate and clustering test |
| Plant Estimate Class & OSBL | AACE Class 3 FEED (10–40% definition) for FID | Captures 80+ MVA substation, water loop, and brownfield foundations | Audit ISBL/OSBL battery-limit split and utility load list |
| Energy & Carbon Boundary | ISO 14404-3:2024 & 40 CFR 98.173 Subpart Q | Separates 350–460 kWh/t melt power from upstream shaft/lime CO2 | Require unit-by-unit GJ/t, kWh/t, and CBAM tCO2/t HRC schedule |
| Exchanger Fouling & Pull Space | Double bundle-pulling space; velocity-verified Rf | Avoids low-velocity sediment buildup and crane turnaround delays | Check TEMA datasheet tube velocity and 3D plot-plan pull envelope |
Frequently Asked Questions
Q: How do you convert steel price per short ton to price per metric tonne and per kilogram?
Multiply the US short ton price by 1.10231 to get the price per metric ton, and divide by 1,000 for the price per kilogram.
Using Gordian’s early-2026 North American structural steel benchmark of $2,343.93 per US short ton, multiplying $2,343.93 by 1.10231 yields $2,583.74 per metric tonne, or $2.58 per kilogram before freight, slitting, and section extras are added to the mill invoice.
Q: How much does steel cost per cubic meter in engineering estimates?
Plain carbon steel contains 7,850 kg per cubic meter, so multiply your delivered $/kg rate by 7,850 for solid volume cost.
Benchmarking against Gordian’s Q4 2026 North American structural steel index of $2,721.31 per short ton ($2,999.73/t, or $3.00/kg), one solid cubic meter (7.85 t) equals $23,548 before cutting scrap. Type 316 stainless steel (~8,000 kg/m3) and wrought aluminium (~2,700 kg/m3) scale directly with their respective alloy densities and monthly surcharges.
Q: Is there a free online steel plant cost estimator for early feasibility screening?
Yes. BOSHIYA publishes a free interactive online Steel Plant Cost Estimator covering BF-BOF, scrap EAF, and hybrid DRI-EAF configurations.
Project sponsors select annual capacity, steelmaking route, regional electricity tariffs, and greenfield or brownfield site conditions to generate AACE Class 4/5 screening ranges in seconds before commissioning a site-specific Class 3 FEED package.
Q: Can I calculate steel material cost using inches and pounds?
Yes, multiply volume (cubic inches) by 0.2836 lb/in3, divide by nesting yield and multiply by your $/lb.
Flat carbon plate estimators also use 40.8 lb/ft2 per inch of thickness.
Q: Why do greenfield EAF mini-mill capital cost estimates vary from $300 million to over $2 billion?
Downstream rolling mill complexity, direct-reduction ironmaking islands, and outside-battery-limit high-voltage grid infrastructure drive that wide capital spread across electric steel plants.
A 0.3–1.5 Mt/yr rebar mini-mill ($300M–$600M in BOSHIYA’s benchmarks) needs one EAF, a billet caster, and a bar mill. Larger, more complex flat-rolled automotive mills would require additional investments in twin-shell EAFs, vacuum degassing equipment, thin-slab tunnel furnaces, hot- and cold-rolling mills, DRI shafts, and heavy utility substations.
Q: Does buying cheaper high-gangue DRI lower liquid steel cost per tonne?
Rarely, because retained silica doubles burnt-lime flux and EAF slag mass, while lowering iron tap yield.
Additional slag causes increased refractory wear and iron oxide losses.
Q: How do manufacturers estimate raw material costs when scrap and coil prices fluctuate?
Procurement teams split fixed shop conversion costs from metal baselines indexed to monthly CRU, Platts, and SteelOrbis prices.
Supply agreements base coils and ferrous scrap on published regional indices, and pass on nickel and molybdenum alloy surcharges at mill invoice. Fabricators credit skeleton scrap at local shredded scrap rates, and limit validity periods of fixed-price quotes.
Benchmark Your Next Steel Plant or Equipment Upgrade
Moving from early route screening to equipment specification? Test various scenarios using the online estimator or contact BOSHIYA’s engineers for information on EAF/DRI equipment, process gas coolers, and turnaround bundle extraction systems.
About This Engineering Cost Analysis
Established in 1915, BOSHIYA Group specializes in designing and manufacturing steelmaking equipment, EPC plant packages and heat-exchanger bundle maintenance machinery. This document pairs U.S. EPA Subpart Q, ISO 14404-3:2024, OECD, U.S. EIA, and Ipieca documents with closed-mass EAF slag stoichiometry, and benchmarks of BOSHIYA’s published plants. The document was reviewed by BOSHIYA Group’s technical team.
References & Sources
- AACE International RP 18R-97 Cost Estimate Classification Summary Cenex Engineering Cost Reference
- Structural Steel Fabrication Waste Factors and Stock-Length Guide RenderDraw Engineering Guides
- Structural Steel Fabrication Estimating Hours and Allowances SteelQuote Estimating Reference
- OECD Steel Outlook 2026: Steel Market and Industry Prospects Organisation for Economic Co-operation and Development (OECD)
- RSMeans Data Q4 2026 Structural Steel Cost Index Gordian Construction Cost Data
- Climate Knowledge Initiative: Global Steel Production and Cost Overview Columbia Business School
- International Energy Outlook: Iron and Steel Sector Analysis U.S. Energy Information Administration (EIA)
- Electric Arc Furnace Steelmaking Cost Model (October 2026) Metals Consulting International (SteelOnTheNet)
- Techno-Economic Assessment of EAF and Hydrogen Direct Reduction Energies (MDPI)
- 40 CFR Part 98 Subpart Q: Iron and Steel Production GHG Reporting U.S. Environmental Protection Agency (EPA)
- ISO 14404-3:2024 Calculation of CO2 Emission Intensity for EAF Plants with DRI International Organization for Standardization (ISO)
- Patent Application EP4127573A4: Heating Direct Reduced Iron Prior to Processing European Patent Office / Google Patents
- How Carbon and Trade Policies Impact the Steel Sector Transition (2026) RMI (Rocky Mountain Institute)
- Energy Efficiency Compendium: Heat Exchangers Ipieca
- Thermal Decomposition for Cleaning Process Equipment Inspectioneering Journal
- Effectively and Efficiently Cleaning Heat Exchangers, Part III Inspectioneering Journal
- Managing Fouling in Heat Exchangers Chemical Engineering Magazine