Get in Touch with BOSHIYA

Heat Exchanger Fouling: A Practical Guide to Diagnosis, Monitoring, and Prevention

Contents
show
Heat exchanger fouling is the accumulation or growth of material on a heat-transfer surface. The deposit causes thermal resistance, restricts flow, changes fluid distribution, or creates a combination of these effects.
A decline in performance does not always indicate fouling. Inlet conditions, flow, the position of control valves, bypassing, the properties of the fluid, leakage, and instrument drift, among others, can cause similar symptoms. A defendable diagnosis begins with a clean baseline and addresses the following: has heat transfer deteriorated? Has hydraulic resistance changed?
Diagnostic rule: normalize the operating data first, then compare thermal and hydraulic evidence. Identify the likely mechanism before choosing an inspection or cleaning response.
What Heat Exchanger Fouling Actually Means
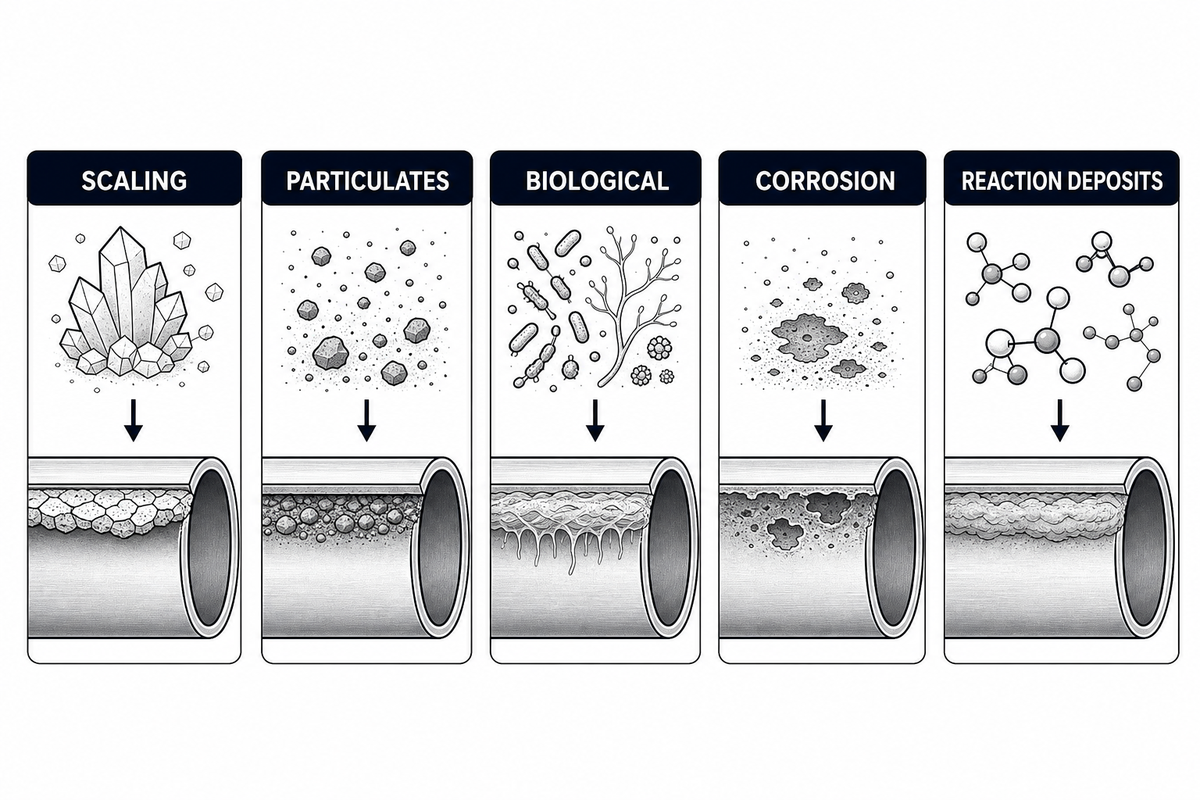
Fouling is not a single material or single failure mode. It is a family of deposit mechanisms that develop on the tube side, shell side, plate surface or other heat-transfer boundaries.
Some of the mechanisms that bring about fouling are scaling or crystallization, particulate deposition, biological and corrosion growth, as well as deposits formed by chemical reactions. Each type of fouling has different causes of fouling and different standards of proof. It is possible to have more than one mechanism occurring at the same time. Published monitoring literature treats particulate contamination, corrosion growth, biological growth, and deposits formed by chemical reactions as different causes rather than one all-inclusive condition.
The “fouling factor” is an engineering allowance expressed as thermal resistance. It helps designers estimate expected deterioration; however, it does not help in identifying the deposit that occurs in service. It is useful to relate outside and inside fouling resistances, along with film and wall resistances, to the overall thermal resistance for analysis of performance. This, however, does not replace inspection and/or characterization of deposit.
Why the mechanism matters
Duty can be reduced by mineral scale, biological film, silt, corrosion, or other sources, and while each of these reduces duty, they each have different causes and require different corrective actions. Removing a deposit resets the clock on the re-occurance. The more constructive question is “What evidence explains where the restriction has occurred and why?”
How Fouling Changes Thermal and Hydraulic Performance
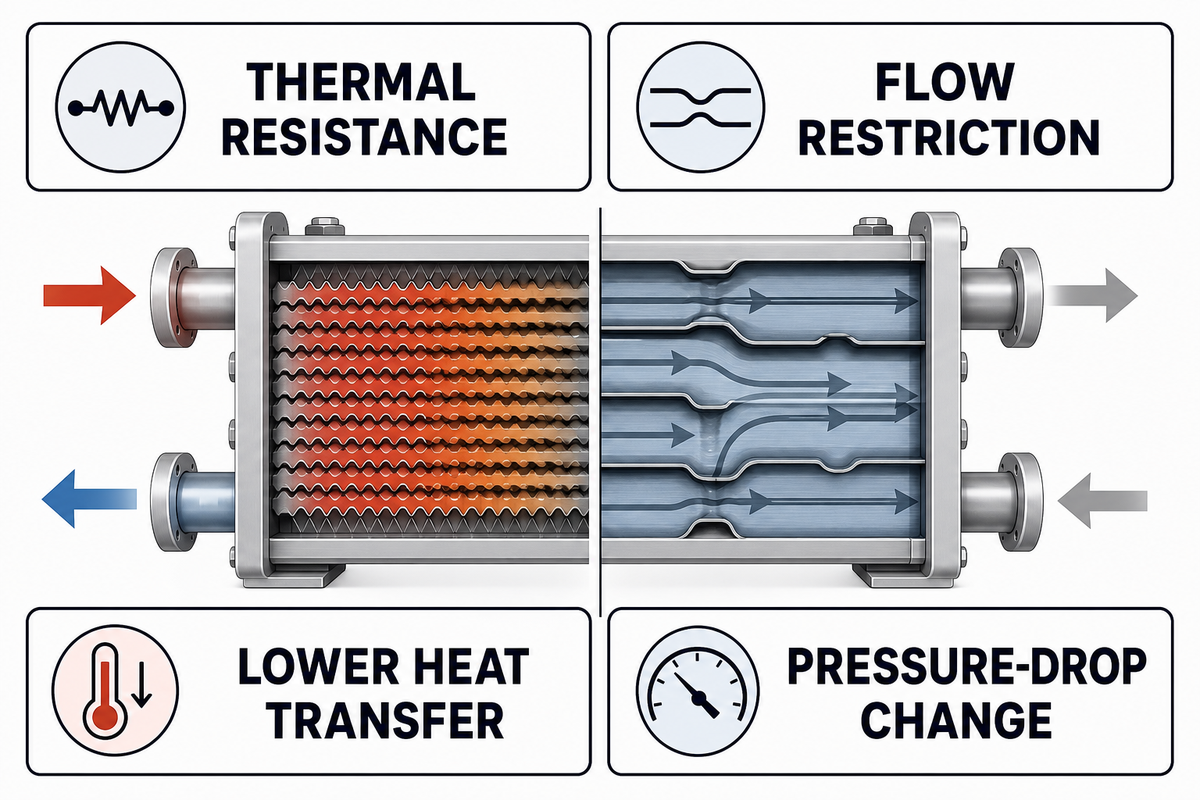
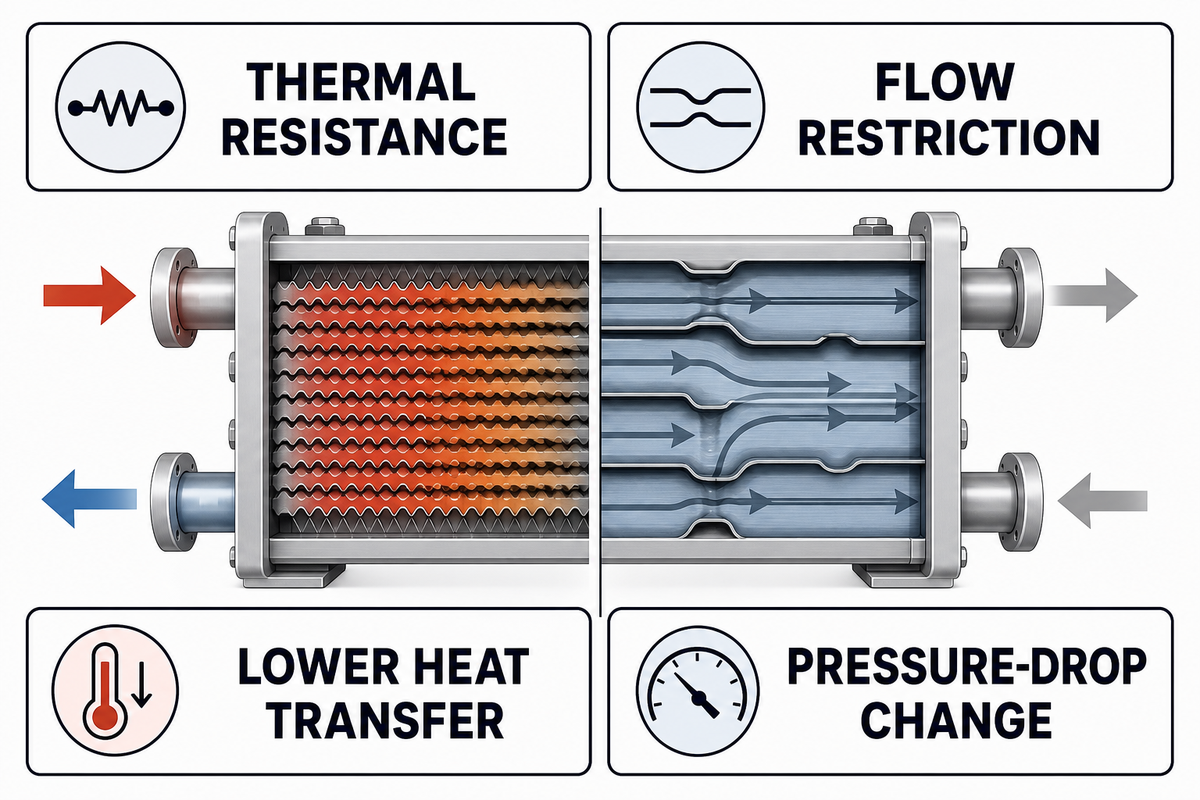
Thermal fouling reduces effective heat transfer, and hydraulic fouling alters or disrupts flow paths. Both can occur simultaneously.
Exchanger duty relates to overall heat-transfer, coefficient, area and temperature-driving force. Operators generally trend a normalized U value instead of comparing raw outlet temperatures. The fouling resistance described in NASA technical literature reduces the overall heat-transfer coefficient. An excessive deposit reduces flow area and increases pressure drop. Flow maldistribution can leave a part of a surface unaffected.
| Diagnostic pattern type | What it may indicate | What to verify next |
|---|---|---|
| Normalized duty falls; pressure drop is nearly stable | A thin thermally resistive film, changed film coefficient, or temperature/flow measurement error | Sensor checks, fluid properties, flow regime, bypass position, and recent chemistry changes |
| Pressure drop rises; normalized duty also falls | Restriction, plugging, thick deposit, or maldistribution | Both sides’ pressure data, strainers, valves, flow measurement, and side-specific inspection |
| Pressure drop rises; duty remains acceptable | Early restriction, increased flow, viscosity change, or a localized hydraulic problem | Normalize for flow and viscosity before assigning the change to fouling |
| Duty changes abruptly without a matching hydraulic trend | Operating change, control action, leakage, bypassing, or bad instrumentation | Historian events, calibration status, control position, and process balance |
| Duty falls after a boiler or utility-side change | Changed utility temperature or flow rather than a new deposit | Utility header conditions, flow, and the time of the operating change |
| Pressure drop changes only on the tube side | Tube-side flow restrictions, plugging, or a valve/strainer problem | Tap boundaries, valve position, strainers, and verified tube-side flow |
| Thermal loss appears only at low load | Changed film coefficient or maldistribution at reduced flow | Reynolds regime, flow split, and clean low-load reference data |
| Energy cost rises while duty is maintained | Additional pump power, utility demand, or control effort may be masking degradation | Normalized utility use, pump operating point, and control saturation |
| Shell and tube heat exchangers show localized symptoms | Geometry and distribution may concentrate deposits in specific zones | Bundle layout, inlet zones, baffles, and side-specific inspection evidence |
Use the matrix to narrow the investigation, then confirm the mechanism with laboratory analysis, process chemistry, corrosion evidence or operating history. A commercially costly error is to assume one piece of evidence (i.e. raw temperature or pressure measurement) proves a mechanism, and then schedule work, before verifying whether operating points being compared are actually equivalent.
Build a Clean Baseline Before Diagnosing Deposits
The effects of fouling should be compared at equivalent operating conditions. That boundary matters for shell and tube heat exchanger services because geometry, flow distribution, and utility conditions can change the observed thermal and hydraulic response.
A clean baseline is a documented set of measurements taken when conditions of the exchangers are known and a performance baseline exists. Without a baseline, a team compares the current performance to memory or design intent, or to operating conditions that may have never been equivalent.
Stable operation occurs after validated maintenance or commissioning. At this time, behavior of the installed exchanger, instruments, controls and process can be evaluated by capturing actual data on clean operation. A design datasheet is of limited value at this time.
- Record inlet and outlet temperatures on both streams.
- Record the best validated flow proxies available.
- Pressure Differentials are pressure loss indicators and should be measured on pressure vessels or points in a system where there is pressure loss.
- Record position of control valves and bypass status. Note pump configuration and recirculation status.
- Record fluid and process conditions that can materially impact system performance, such as fluid density and viscosity, phase, and concentration.
- Duty, calculated or normalized overall performance should be captured, and the methodology for calculation should be documented.
- Preserve calibration status, timestamp alignment, and known instrument uncertainty.
US patent US7827006B2 describes techniques for identifying abnormal heat-exchanger behavior by monitoring characteristics such as thermal resistance during normal operation. The discussed case methods can be used to monitor various types of equipment during normal operation.
Baseline checkpoint: if flow, fluid properties, temperature driving force, or control configuration changed, normalize or segment the data before interpreting the trend.
Separate Tube-Side and Shell-Side Evidence
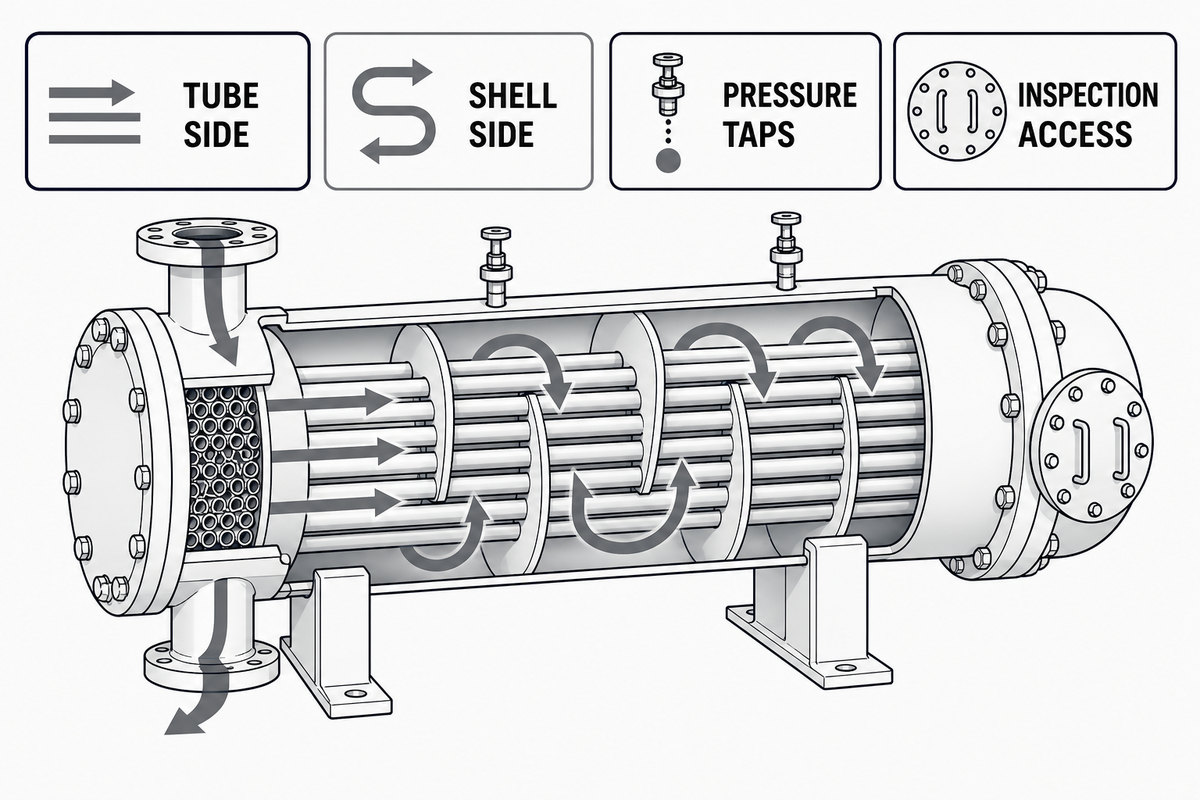
The same performance symptom can occur on either side of the exchanger. Side attribution requires drawings, pressure taps, stream history, chemistry, and when justified, inspection evidence.
Let’s start with exposure. Cooling water, process fluids, and condensing services put surfaces in contact with different deposit precursors. Use the mechanism categories in published exchanger-monitoring literature to ask which stream carries suspended solids, scaling ions, organisms, corrosion byproducts, or reaction intermediates. Next, look at velocity and temperature zones. Poor velocity regions can cause scaling; hot surfaces can promote a chemical reaction; and poor fluid distribution can cause a concentration of deposit in only part of the outside bundle cleaning area.
Pressure drop is only meaningful when the measured taps truly bracket the flow path of interest. Flow velocity and turbulence change the film coefficient and the probability that particles will remain suspended. A long piping run or a control valve upstream of the plant reading can mask an exchanger signal. An overall thermal trend does not necessarily mean that the resistance is in the tubes.
Use inspection to answer a defined question
Inspection becomes more valuable when we have some operating data that provides a hypothesis. This may include where blockage may be concentrated, whether deposits are internal or external, whether corrosion products are present, or whether a suspected biological layer is treatment related. Depending on which of these may be the case, we may choose a different inspection method or sample location.
Do not jump to the conclusion that deposit chemistry is represented by color or texture. You may need evidence from laboratory analysis, water or process chemistry, corrosion, or operating history to identify the root cause of a problem.
Monitor Fouling Without Relying on One Number
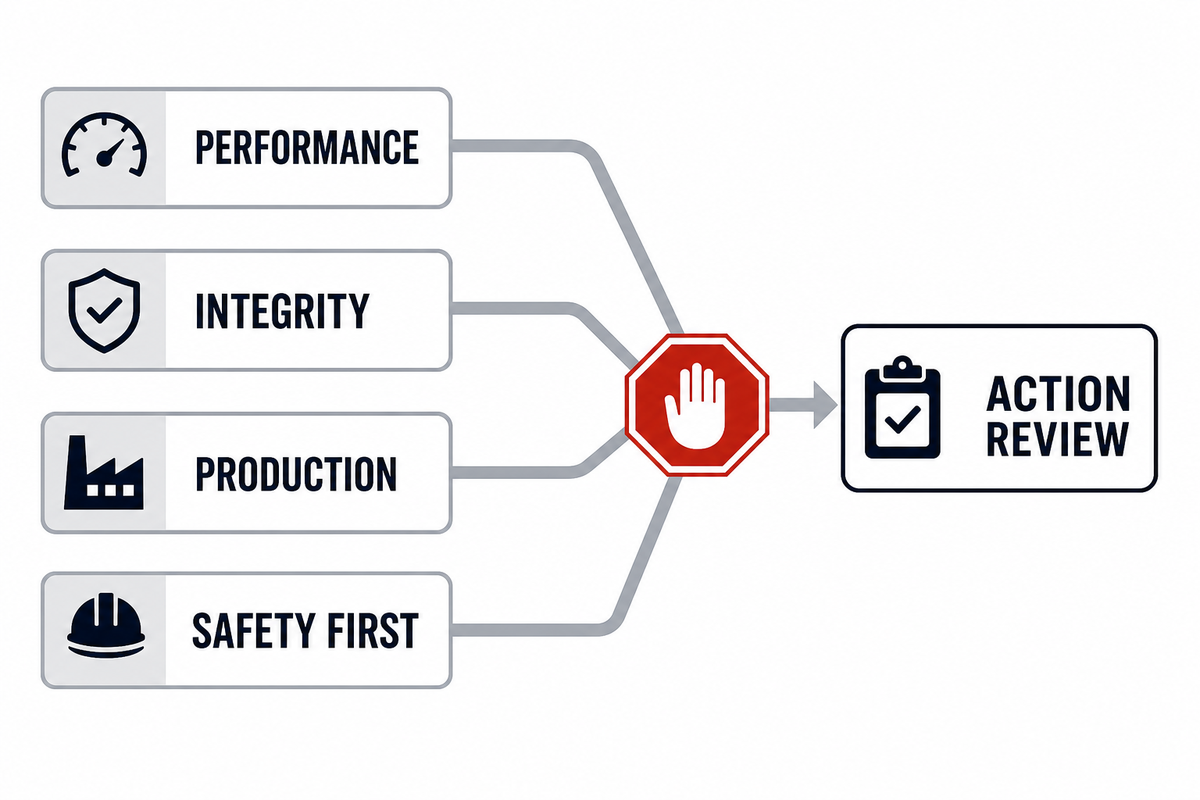
Thermal duty and hydraulic resistance are separate indicators of exchanger performance, and a normal pressure drop alone does not show that the exchanger is clean.
It is possible to trend normal operation and correlate this with side-specific pressure drop, flow, approach temperature, control position, and relevant chemistry. According to the US Department of Energy operations and maintenance guide, temperature-derived changes in heat transfer may support the case for tube cleaning or chemical treatment. The key word here is support: temperature data may be used in making a case when the base line and operating conditions are reasonable.
- Check sensor health and valve position. Temperature data should correlate with fluid properties and be consistent with operation.
- Integrate thermal and hydraulic trends with corrosion and heat exchanger maintenance history.
- Verify evidence and rationale for adjusting operation.
Patterns in data matter. Looking at trends, a gradual normalized decline calls for one type of investigation while a step change after a feed or control event requires something else. Repetitive saw-tooth behavior after a process modification can reveal the operating mechanism. Predictive analytics can provide insights into what might happen in the future if a strong enough baseline and history is established, but the model cannot remedy a weak sensor or ill-defined clean state.
Control the Root Cause Before Choosing a Cleaning Method
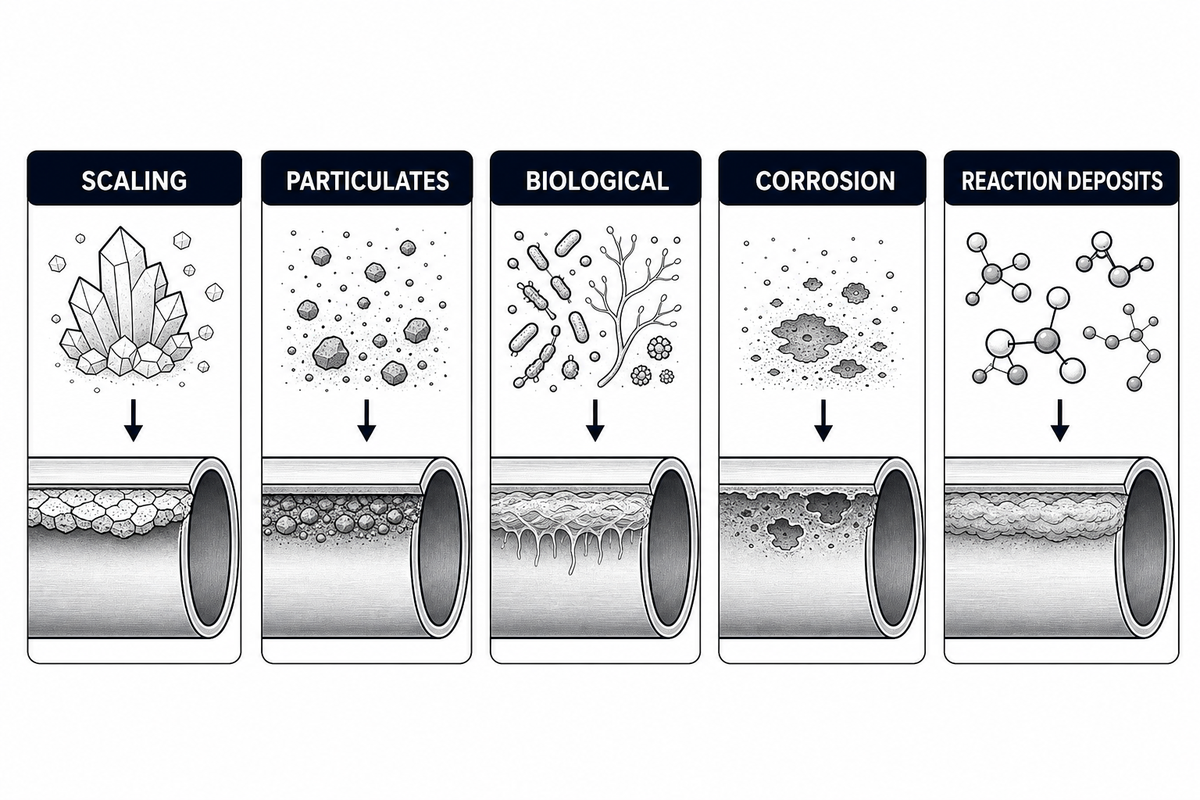
Prevention focuses on the mechanism that generates or retains the deposit. Control of that mechanism results in a reduction of the consequence.
| Likely mechanism | Evidence to seek | Root-cause controls to evaluate |
|---|---|---|
| Crystallization or scale | Water/process chemistry, saturation tendency, wall-temperature zones, hard deposit analysis | Chemistry control, temperature limits, concentration management, treatment performance |
| Particulate deposition | Suspended solids, inlet loading, velocity distribution, settling zones, strainer history | Upstream separation, filtration, flow distribution, velocity and solids handling |
| Biological growth | Microbiological results, nutrient and temperature conditions, treatment residual, slimy deposits | Validated biological control, dead-leg reduction, treatment delivery and monitoring |
| Corrosion products | Metallurgy, corrosion rate, iron/copper indicators, localized damage, deposit composition | Materials compatibility, oxygen/pH control, corrosion program, source-equipment repair |
| Reaction deposits | Feed composition, residence time, wall temperature, off-spec events, deposit chemistry | Process condition control, mixing, temperature profile, residence time, precursor management |
After the mechanism is understood, the maintenance team can compare appropriate removal options in Boshiya’s separate heat exchanger cleaning methods guide. Keeping that decision separate avoids competition with the existing cleaning method page.
Decide When Inspection or Cleaning Is Justified
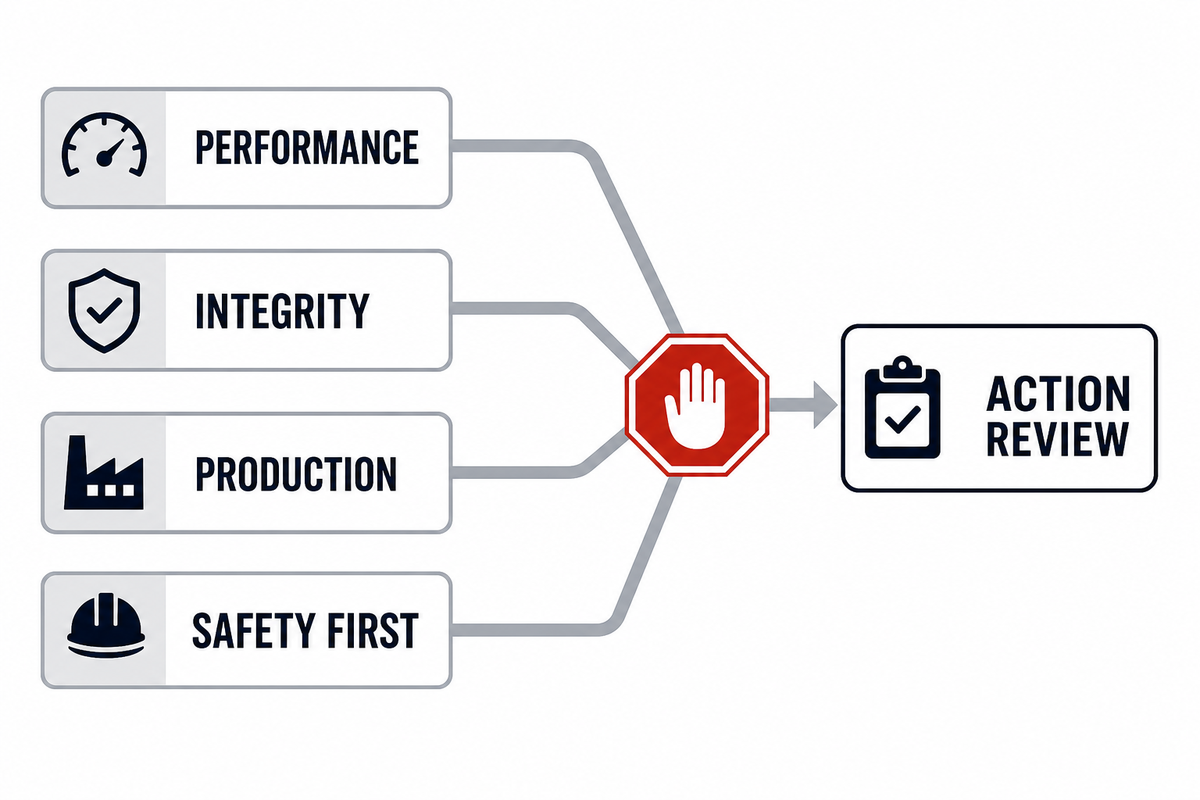
Inspection or cleaning is warranted when the equipment deterioration leads to threat to: duty, hydraulic capacity, product quality, energy performance, controllability, reliability or operating within safe limits. The expected benefit of the intervention must outweigh the risk and cost of the interruption to normal operations.
Use site-specific, not universal, triggers. Relevant evidence can include a sustained normalized performance decline, control saturation, loss of process capacity, control excursions, leak risk, deposit-related instability, among others. A noisy outlier should be validated; consistent trend across multiple, independent signals should be investigated.
In the presence of suspected tube failure, cross-contamination, loss of containment, abnormal pressures or temperatures, operation outside approved limits, or any other safety concern, safety takes priority over (and supersedes) the need for optimization. UK HSE guidance considers failure modes and safeguards of exchangers as safety matters. Thus, an efficiency calculation cannot be made to justify postponement of an inspection or shutdown.
Once the need for maintenance is established, teams planning to bundle access or cleaning equipment may proceed to Boshiya’s bundle cleaning pillar page. This page is responsible for equipment selection and the commercial handoff; this document is focused on timing and diagnosis.
Frequently Asked Questions
What is heat exchanger fouling?
Heat exchanger fouling refers to the undesired presence of material or organisms on a heat-transfer surface. It can lead to thermal resistance, restrict flow passage, alter distribution, promote corrosion, and/or combine to cause multiple adverse effects. The term describes a condition and therefore a diagnosis must be made to determine the potential causes and where the condition is likely occurring.
How can I tell whether a heat exchanger is fouled?
Compare normalized thermal performance and side-specific pressure drop to a verified clean baseline. Then assess flow and fluid properties, control position, bypass status, and instrument condition. A coherent change in multiple indicators supports a fouling hypothesis. Individual temperature and pressure readings cannot distinguish deposits from changes in the operation or in the way the measurement is done.
What causes fouling in a heat exchanger?
Common fouling mechanisms are scaling or crystallization, particulate deposition, biological growth, corrosion growth and deposits formed by chemical reactions, and more than one can occur at the same time. These are a function of temperature, velocity (time and/or surface conditions), fluid chemistry, residence time, and flow distribution.
What is fouling resistance?
Fouling resistance is the thermal resistance assigned to deposit effects. A fouling factor may be used to account for it in design. In operation, it may be estimated using performance data. It does not, by itself, identify the deposit material or which side of the exchanger is affected.
Does fouling always increase pressure drop?
No. A thin thermally resistive film can lower normalized duty while pressure drop stays nearly stable, and pressure drop can also change with flow rate, viscosity, valves, strainers, or instrument conditions. Analyze hydraulic data at comparable conditions and in conjunction with normalized heat-transfer performance.
How can heat exchanger fouling be prevented?
Prevention is reliant on the mechanism. Options may consist of chemistry or biological control, filtration and solids removal, corrosion control, process stability, improved distribution or operation within the validated velocity and temperature limits. Control the cause demonstrated by the plant evidence, not a generic list.
When should a heat exchanger be cleaned?
Clean when deterioration threatens duty, hydraulic capacity, product quality, energy performance, controllability, reliability or safe operating limits, and the expected benefit outweighs the risk and cost of the interruption. Evidence may include verified degradation, inspection findings, process constraints or safety. Site-specific evidence is usually more effective than a fixed calendar because deposit rates vary with service conditions. If the evidence supports a mechanism, determine the likelihood of that mechanism and weigh recovery against downtime, access and cleaning risk. When evidence remains mixed, define what an inspection must resolve before selecting a method; this prevents an outage from becoming an expensive trial that removes material without correcting its source.
References & Sources
- NASA: Heat-Exchanger Design for Gas-Side Fouling Service
- U.S. Department of Energy: Operations and Maintenance Best Practices
- UK HSE HSG274 Part 1: Heat Exchanger Inspection and Fouling Guidance
- US7827006B2: Heat Exchanger Fouling Detection
- US7455099B2: Heat Exchanger Performance Monitoring and Analysis